Last Updated on February 16, 2022 by Stephan Lindburg
Technical Analysis For Bitcoin Today: February 16, 2022
BTC Charts Short, Mid & Long
Important Information
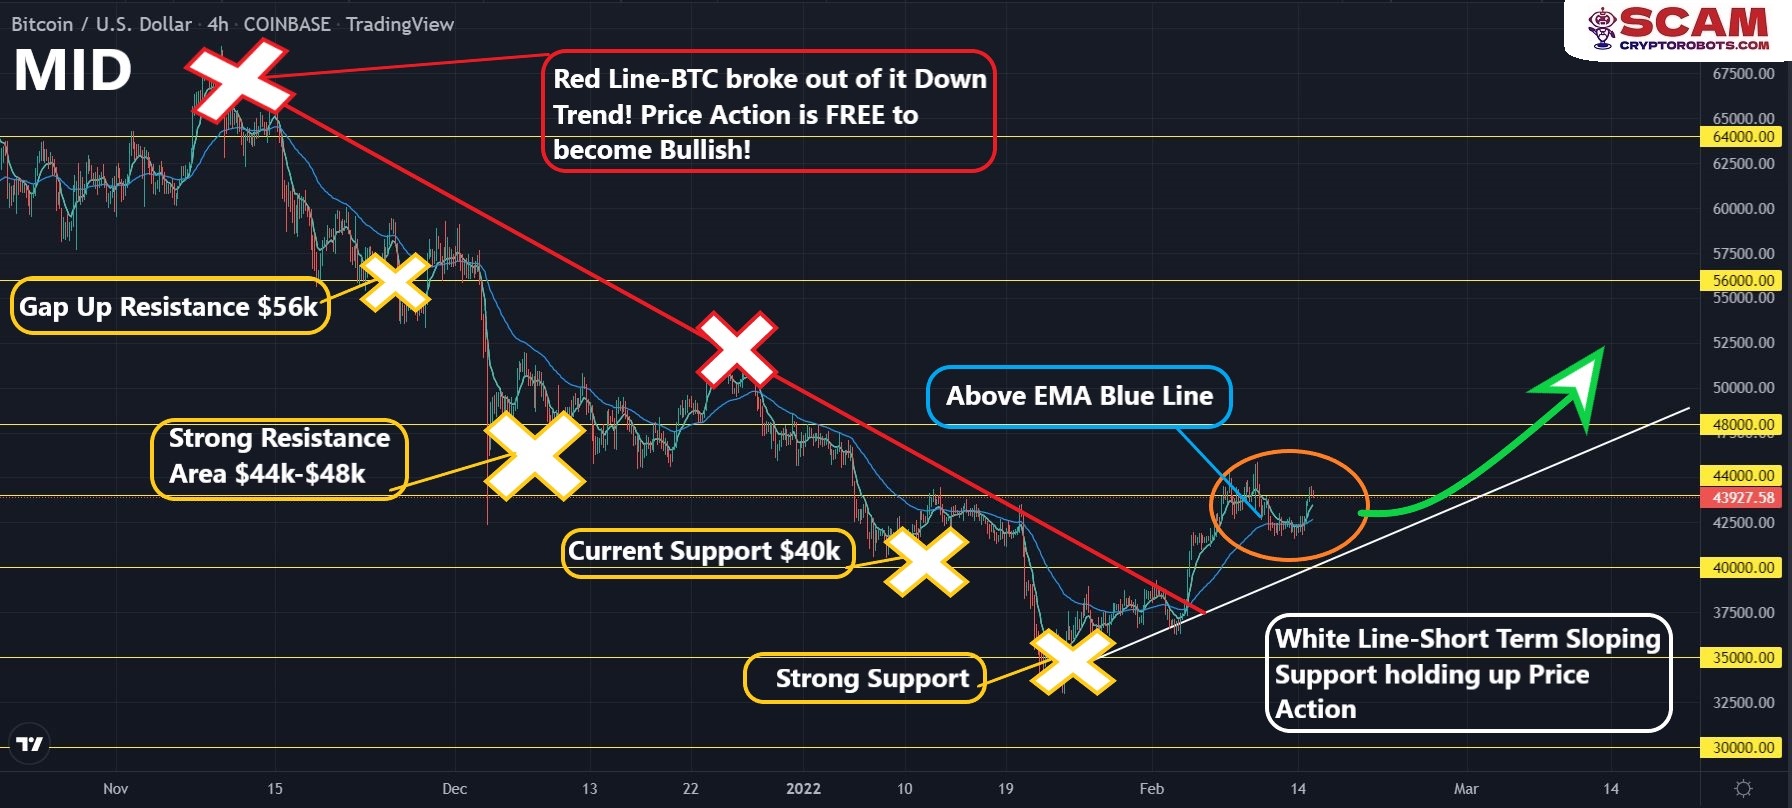
White Sloping Line with Arrows-Sloping Support validating Uptrend! Price needs to stay above White Lines no matter what to stay Bullish! If Price ever breaks below White Line, Price & Trend will most likely go Bearish!
Red Line-Sloping Resistance, this is where Price is Bearish until the Price breaks above the Red Line! When Price breaks above Red Line it will become Bullish!

Yellow Areas-Key Support & Resistance Areas where you can “Buy or Sell”
When it comes to BTC I believe we are headed back to the upside, However I think it will take some time since it is hitting strong resistance Areas at $44k-$48k, BTC is also heavily influenced News! BTC was created due to Inflation!
Green Arrows – What We Expect To Potentially Happen!
The overall charts look Bullish to me! I do see that there is a Inverse Head & Shoulders Pattern on the Short Term Chart!

These Patterns are Bullish, So I do expect the Price to move Upwards! Does this mean it will 100% play to the Upside, No! We could always have a Fakeout back to the White Lines Sloping Support! It is CRITICAL BTC stays above the Short Term non the less the Long Term Sloping Supports to remain Bullish! If BTC Price falls look for Supports at $42k-$40k to White Line! Overall, as stated I’m expecting moves to the Upside!
Please keep in mind, any NEWS, Any CATALYST, Can affect the charts! Fundamentals will always take over Technical Analysis!
Good luck! Be Careful & Manage Your Risk!